Carbon Dioxide Emissions
Some of you might have seen the news that came out earlier this year,that an iceberg about the size of Malta broke off Pine Island Glacier in West Antarctica. What’s sad is that we hear this quite often these days,reminding us that climate change is real.The pale blue dot we are living in,is increasingly warming up causing shifts in climate patterns.Climate change is not to be taken lightly as it not only encompasses global warming.The repercussions of climate change include rising sea level,extreme weather conditions like hurricanes etc, shift in wildlife habitats,all of which affects human living conditions. Long story short,climate change is bad news.Every country should undertake responsible policies to rein in the carbon dioxide and other greenhouse gas emissions which is the major contributor to global warming.This blog post aims to have a quick look into the production based carbon dioxide emissions in Australia and the World and tries to answer the following questions,
- What is the yearly trend in global annual production-based emissions of carbon dioxide ?
- Which sectors are the major contributors of global carbon dioxide emissions?
- What is the yearly trend in global annual production-based emissions of carbon dioxide in Australia?
- Is Australia decarbonizing?
- Is there any pattern seen in the total power generated by renewable energy and carbon dioxide emission in Australia?

Image Source : Harvard Business Review
For this analysis,I have mainly taken data from Our World in Data,from which I collected the data on carbon dioxide emissions. Other data sources include The International Energy Agency,from which I have collected the data on major contributors of carbon dioxide emissions from fuel combustion and also The International Renewable Energy Agency from which I have taken the total renewable energy generated in Australia yearly.
Let’s take a glance at the datasets used below, starting with the carbon dioxide emissions dataset.Below depicted is a glimpse of some of the variables and it’s observations in the dataset.
## Rows: 24,016
## Columns: 10
## $ iso_code        <chr> "AFG", "AFG", "AFG", "AFG", "AFG", "AFG", "AFG", "A...
## $ country         <chr> "Afghanistan", "Afghanistan", "Afghanistan", "Afgha...
## $ year            <dbl> 1949, 1950, 1951, 1952, 1953, 1954, 1955, 1956, 195...
## $ co2             <dbl> 0.015, 0.084, 0.092, 0.092, 0.106, 0.106, 0.154, 0....
## $ co2_growth_prct <dbl> NA, 475.000, 8.696, 0.000, 16.000, 0.000, 44.828, 1...
## $ co2_growth_abs  <dbl> NA, 0.070, 0.007, 0.000, 0.015, 0.000, 0.048, 0.029...
## $ consumption_co2 <dbl> NA, NA, NA, NA, NA, NA, NA, NA, NA, NA, NA, NA, NA,...
## $ trade_co2       <dbl> NA, NA, NA, NA, NA, NA, NA, NA, NA, NA, NA, NA, NA,...
## $ trade_co2_share <dbl> NA, NA, NA, NA, NA, NA, NA, NA, NA, NA, NA, NA, NA,...
## $ co2_per_capita  <dbl> 0, 0, 0, 0, 0, 0, 0, 0, 0, 0, 0, 0, 0, 0, 0, 0, 0, ...
Similarly,the contents of the dataset containing sector wise contributors of the global carbon dioxide emissions are listed below.
## Rows: 6
## Columns: 11
## $ Year                                        <dbl> 1990, 1995, 2000, 2005,...
## $ `Electricity and heat producers`            <dbl> 7622, 8163, 9358, 10970...
## $ `Other energy industries`                   <dbl> 975, 1068, 1195, 1403, ...
## $ Industry                                    <dbl> 3955, 3938, 3875, 4928,...
## $ Transport                                   <dbl> 4609, 5025, 5770, 6499,...
## $ Residential                                 <dbl> 1832, 1849, 1830, 1903,...
## $ `Commercial and public services`            <dbl> 765, 718, 696, 773, 810...
## $ Agriculture                                 <dbl> 398, 402, 340, 398, 396...
## $ Fishing                                     <dbl> 18, 18, 19, 24, 23, 20
## $ `Final consumption not elsewhere specified` <dbl> 342, 191, 159, 181, 205...
## $ Units                                       <chr> "Mt CO2", "Mt CO2", "Mt...
In order to make analysis easier,the sector wise data is pivot longer.Similar process goes to the dataset on electricity generated in Australia using renewable energy shown below. The data is made to be longer inorder to make analysis easier.The values depicting year and electricity generated was removed of the space present in it.
## Rows: 2
## Columns: 23
## $ Indicator      <chr> "Electricity generation (GWh)", "Electricity generat...
## $ `Country/area` <chr> "China", "Australia"
## $ `2 000`        <chr> "222 955", "17 590"
## $ `2 001`        <chr> "278 132", "18 162"
## $ `2 002`        <chr> "288 813", "17 874"
## $ `2 003`        <chr> "284 694", "18 619"
## $ `2 004`        <chr> "354 852", "18 683"
## $ `2 005`        <chr> "401 114", "20 103"
## $ `2 006`        <chr> "442 586", "21 641"
## $ `2 007`        <chr> "496 290", "21 012"
## $ `2 008`        <chr> "606 279", "19 725"
## $ `2 009`        <chr> "654 484", "18 601"
## $ `2 010`        <chr> "780 008", "21 720"
## $ `2 011`        <chr> "783 049", "26 273"
## $ `2 012`        <chr> "994 392", "26 318"
## $ `2 013`        <chr> "1 086 041", "32 702"
## $ `2 014`        <chr> "1 269 856", "36 112"
## $ `2 015`        <chr> "1 381 355", "33 422"
## $ `2 016`        <chr> "1 522 405", "37 152"
## $ `2 017`        <chr> "1 645 371", "40 205"
## $ `2 018`        <chr> "1 811 174", "44 443"
## $ `2 019`        <lgl> NA, NA
## $ X23            <lgl> NA, NA
What is the yearly trend in global annual production-based emissions of carbon dioxide ?
Before going deeper into the analysis,it is very important to note that there are two main kinds of carbon dioxide emissions,that is production based and the consumption based emissions.Throughout the analysis,I have focused on the production based emission that is the emissions from the burning of fossil fuels, or cement production within a country’s borders and not the consumption based that encompasses effects of trade. Ever since the human society transitioned into an industrial age with the onset of industrial revolution,the amount of atmospheric carbon dioxide has increased in an unimaginable level,altering the balance of nature.Figure 1 shown below depicts the trend in CO2 emissions on a global level.Since the 1900s there is a steep increase in the carbon dioxide emission level due to fuel combustion.With the increasing deforestation,the produced carbon dioxide emissions trapped inside the atmosphere without the presence of enough plants and trees which usually aids in the absorption of carbon dioxide.
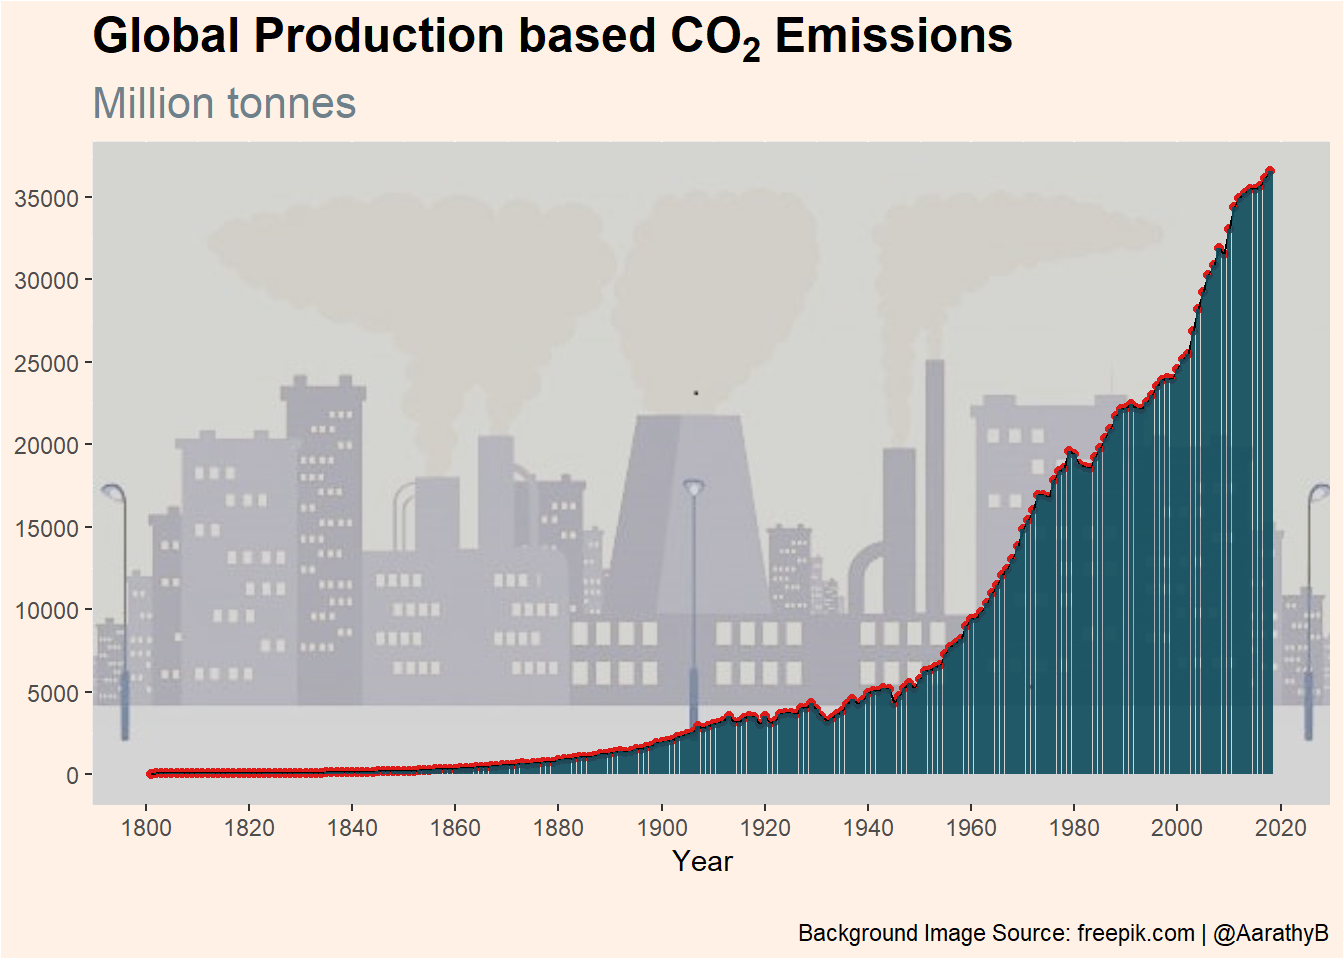
Figure 1: The figure shows the yearly trend in global annual production based emissions of carbon dioxide.The level of emissions has been increasing ever since the industrial revolution in the 18th century.
Which sectors are the major contributors of global carbon dioxide emissions?
We hear about CO2 emissions all the time,so let us now look into who the major contributors to the emissions are.Figure 2 depicts the 5 year carbon emission level of contributing sectors like transport,agriculture etc. It can be seen that the major contributor is Electricity and Heat producers where as sectors like fishing ,agriculture and other energy industries are relatively low. Therefore,it is very important for countries to shift from major energy sources like coal,oil for electricity and heat generation to more sustainable and low carbon emitting energy resources like renewable energy resources.
Figure 2: The figure shows the emission levels of major contributors like Electricity and heat producers,Transport etc at a 5 year interval.Industrial sector has seen a steep increase in emission levels between 2000 and 2010.
What is the yearly trend in global annual production-based emissions of carbon dioxide in Australia?
According to the Center for Global Development,developed countries are responsible for 79 Percent of historical carbon emission. Let us now look at historical emissions of Australia,which is a highly developed country, with the world’s fourteenth-largest economy.Figure 3 shows the historical data on Australia’s carbon dioxide emissions.Australia welcomed the industrial revolution in the 1800s and the level of emissions started rising since then.We can also observe that since the 1900s,the emission level has accelerating till 2010 after which it saw a decrease but it seems the dip in levels did not last long as it later picked up it’s pace.
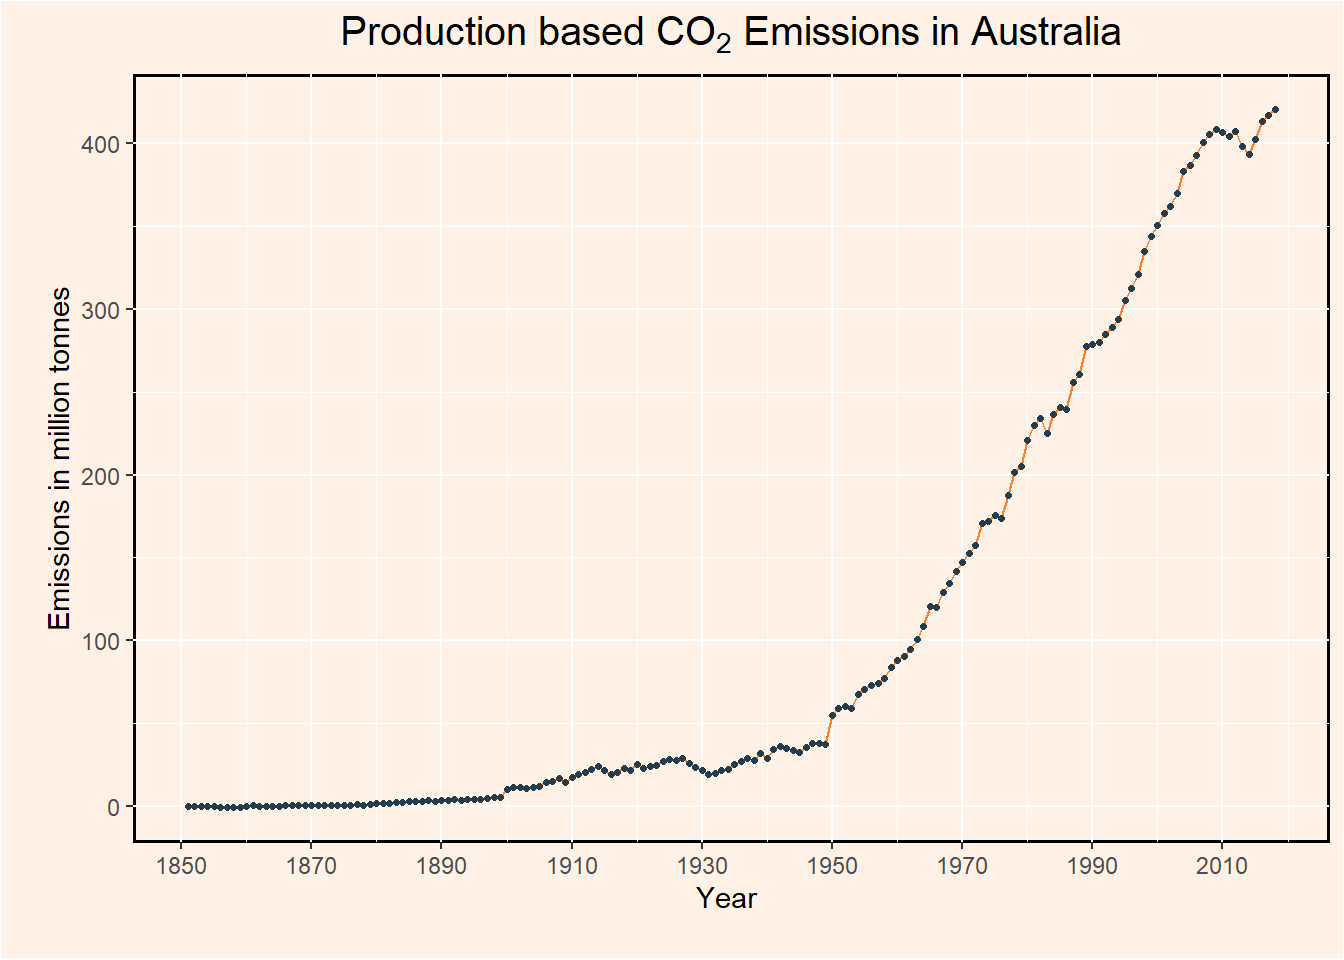
Figure 3: The figure depicts the carbon dioxide emissions in Australia over the years.The level of emissions has been accelerating since the 1900s.
Is Australia decarbonising?
Now that we have seen the yearly carbon dioxide emission in Australia,let us now look at the change in emission compared to the previous year in figure 4.We can see a zig-zag pattern of increase and decrease showing considerable difference in relative change in emission for about 100 years,from 1850s to 1950s,after which the difference decreased.From this we can say that during those 100 years,some years produced more emissions than the others.We can also observe that since the 1990s,there is very little change in carbon dioxide emissions in Australia but this is not enough evidence that Australia is decarbonizing.It is very interesting to see that in 1860,there was very low carbon dioxide emission when compared to the previous year so I did some detective work.Although this is just an assumption,I thought I will mention what I think could be related to the dip in emission in that year.It seems that gold which transformed Australia economically and politically in the 1800s ran out by 1860.The surplus labour force was then inducted from gold fields to manufacturing sector which could be the reason that carbon emission went low in 1860 and picked up its pace after 1860.Again,this is just an assumption but I thought it is worth mentioning.
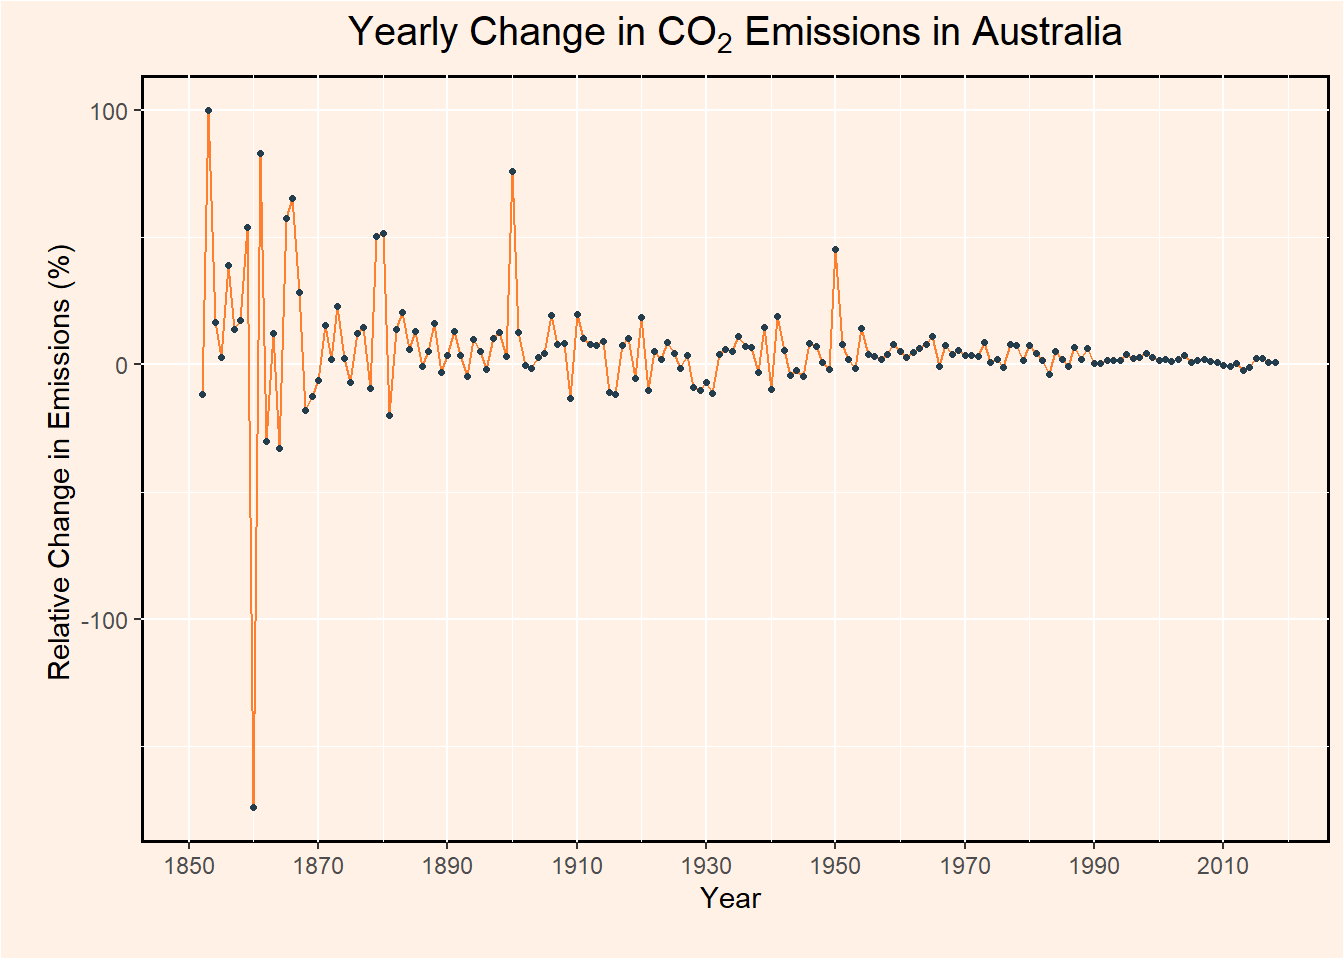
Figure 4: The figure shows the yearly change in carbon dioxide emission in Australia.In the recent years,there is not much change in the level of emission.
Is there any pattern seen in the total power generated by renewable energy and carbon dioxide emission in Australia?
Shifting to clean energy could be the first step to decarbonization and the first step to rein in climate change.Lets looks into the renewable energy sourced electricity production from the year 2000 to 2018 as well as the relative change in emissions in Australia during that time period.Figure 5 shown below depicts the correlation between the percentage difference in electricity produced using renewable energy,compared to previous year and the percentage change in carbon dioxide emissions each year.We can see a correlation of -0.65 between the two which shows that increase in renewable energy does align with decrease in carbon dioxide emission.That being said,correlation does not imply causality.We cannot confidently say that the reason of decrease in emissions is due to the increase in renewable energy sourced electricity generation.
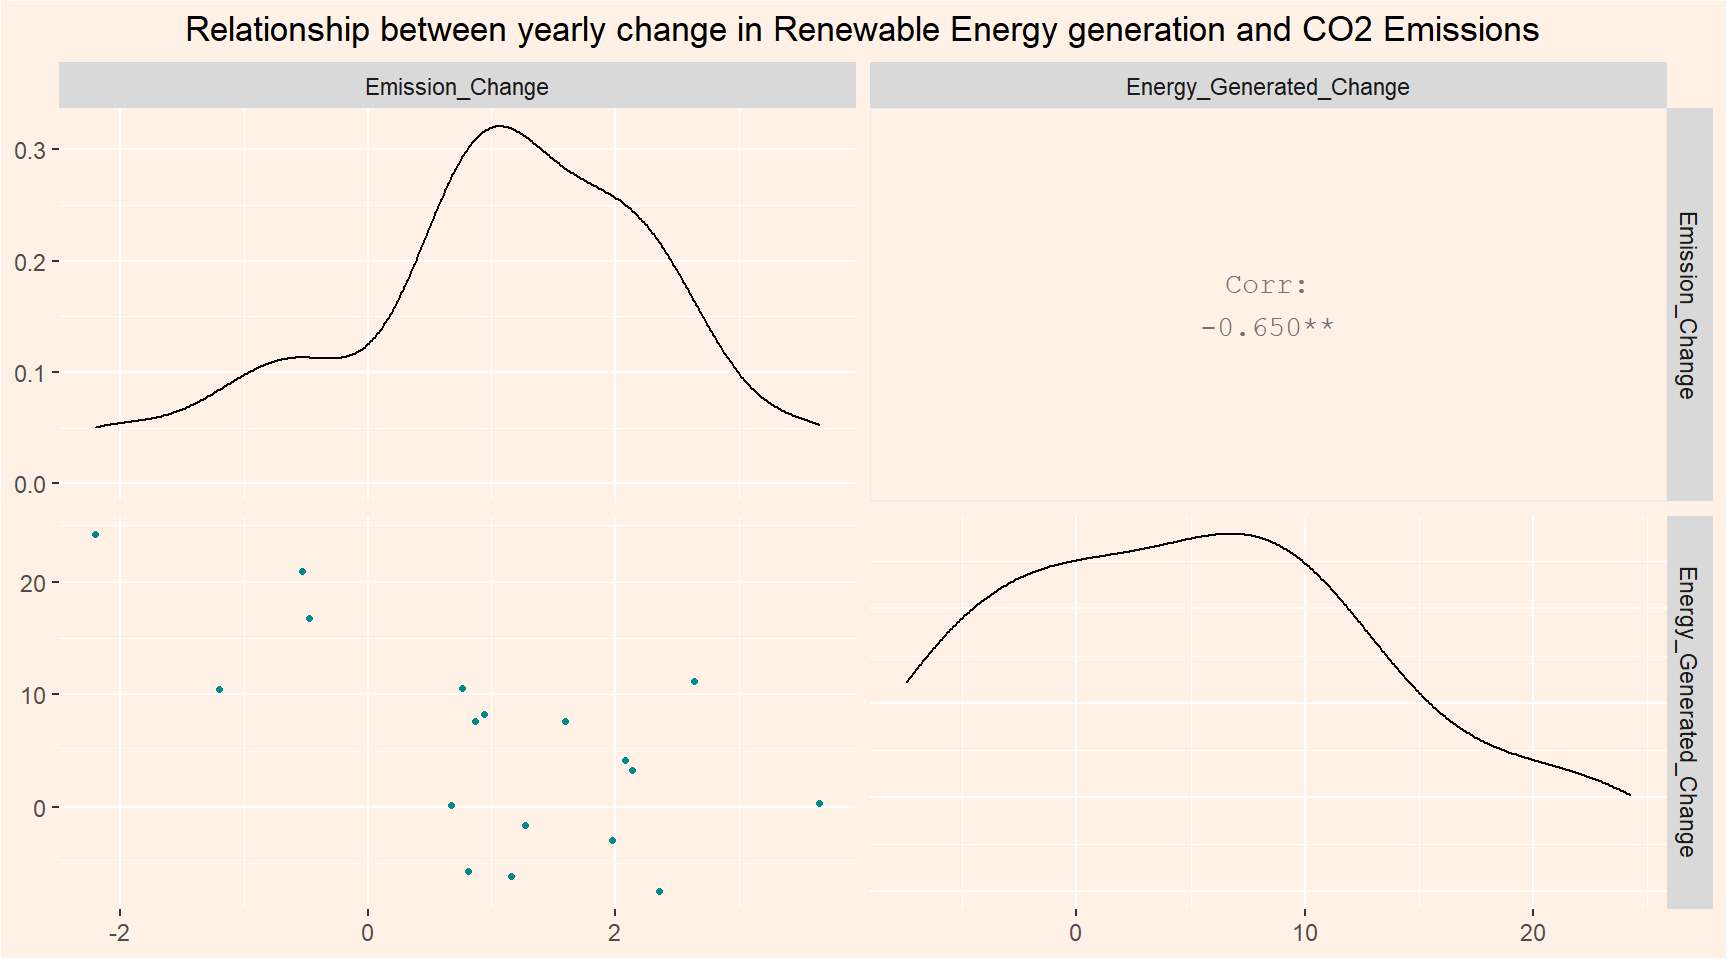
Figure 5: The figure shows the correlation between renewable energy and emissions in Australia.There is a negative correlation between the two.
Throughout this analysis we have learnt that the Australian and global CO2 emissions are increasing at an alarming level and the major contributors for it are the electricity and heat producers who heavily depend on carbon rich energy sources like coal and oil.Therefore it is critical to shift to clean energy with low emission.We also saw that usage of renewable energy resources have a negative correlation with annual carbon dioxide emissions in Australia.
Thank you for taking the time to read this.Hope you enjoyed it.
Aarathy Babu
Student
Post-Grad Student| Business Analytics | Monash University | Here to live my life so well that death would tremble to take me.